Lynsyn Lite: Difference between revisions
Christopherh (talk | contribs) |
Christopherh (talk | contribs) |
||
| Line 145: | Line 145: | ||
==== Viewing a Session if Recorded from the Command Line or from a Previous Save ==== | ==== Viewing a Session if Recorded from the Command Line or from a Previous Save ==== | ||
If you recorded the session via the command line, from the Lynsyn folder you created, launch the “<code>lynsyn_viewer.exe</code>” application. | If you recorded the session via the command line, from the Lynsyn folder you created, launch the “<code>lynsyn_viewer.exe</code>” application. | ||
<p> | |||
When opening it will display the previous result by default. To load the latest set of sampled data, go to “'''File'''” then “'''import CSV.'''”<p> | |||
[[File:Lynsyn viewer import.png|frame|left|Lynsyn viewer import]] | |||
<div style="clear: both"></div> | |||
Select the file (by default it has “output.csv”) and press OK. <br> | |||
After a few moments it should say “Import Done” and a graph of the recorded session will be shown. | |||
[[File:Lynsyn viewer Profile graph.png|frame|left|Lynsyn viewer Profile graph]] | |||
<div style="clear: both"></div> | |||
You can interact with the graph using your mouse. If you draw a box round a section (left button), it will zoom in. Left clicking will show the values at that point. | |||
Right clicking will zoom out again. | |||
=== LINUX === | |||
==== Recording a Session ==== | |||
===== From the command line ===== | |||
<ol> | |||
<li> | |||
Open a terminal window. As you got, built and installed the files previously, you don't need to be in a specific folder to run the applications. | |||
</li> | |||
<li> | |||
To start logging a session you need to use the '''<code>lynsyn_sampler</code>''' application.<br> | |||
[[File:Lynsyn sampler linux.png|frame|left|Lynsyn sampler windows]] | |||
<br> | |||
<div style="clear: both"></div> | |||
For this simple example we will be just setting to run the application for a 30 second session and saving the data to the default “output.csv” file. To run it for longer or shorter, just change the number at the end. <br> | |||
'''''WARNING – These files can get large fast. This 30 second sample is around 63Mb<br>You need to be sudo so the computer can interact with the Lynsyn Lite.'''''.<br> | |||
The format for this is:<br> | |||
<code>sudo lynsyn_sampler -d 30</code> | |||
[[File:Sampler 30 seconds linux.png|left|frame|Running the Sampler for 30 Seconds]] | |||
<div style="clear: both"></div> | |||
Once finished you will get the command line prompt back. | |||
</li> | |||
</ol> | |||
===== From the GUI ===== | |||
Open a terminal window and type:<br> | |||
<code>sudo lynsyn_viewer</code><br> | |||
'''You need to be sudo for the computer to interact with the Lynsyn Lite.'''<br> | |||
This will launch the Lynsyn Viewer application.<br> | |||
Once loaded, in the top left corner there are two buttons, “'''Profile'''” and “'''Live'''” | |||
[[File:Lynsyn viewer Profile and live.png|left|frame|Lynsyn viewer Profile and live]] | |||
<div style="clear: both"></div> | |||
Pressing the “Live” button brings up a box showing what is happening NOW:<br> | |||
[[File:Lynsyn viewer LIVE.png|frameless|left|Lynsyn viewer LIVE]] | |||
<div style="clear: both"></div> | |||
The “Profile” button brings up a box in which you select the length of the sampling you wish to have.<br> | |||
Pressing OK starts the sampling. When complete, “Profiling Done” is shown and the new set of samples are shown in the graph. | |||
<p> | |||
Next to these two buttons are three dropdown lists. One selects the parameter shown (Current, Voltage or Power), the second selects which sensor.<br> | |||
In our example, the third is un-used.<br> | |||
You can interact with the graph using your mouse. If you draw a box round a section (left button), it will zoom in. Left clicking will show the values at that point.<br> | |||
Right clicking will zoom out again.<br> | |||
[[File:Lynsyn viewer Profile graph.png|frame|left|Lynsyn viewer Profile graph]] | |||
<div style="clear: both"></div> | |||
To save this data, go to “File” then “Export CSV.” | |||
==== Viewing a Session if Recorded from the Command Line or from a Previous Save ==== | |||
If you recorded the session via the command line and wish to view the results, launch the “'''lynsyn_viewer'''” application <code>sudo lynsyn_viewer</code>. | |||
<p> | <p> | ||
When opening it will display the previous result by default. To load the latest set of sampled data, go to “'''File'''” then “'''import CSV.'''”<p> | When opening it will display the previous result by default. To load the latest set of sampled data, go to “'''File'''” then “'''import CSV.'''”<p> | ||
Revision as of 10:53, 1 November 2024
About
The Lynsyn Lite is a dual-purpose card for both power measurement and JTAG communications.
It can monitor voltage and current on three independent sensors, with voltage ranges between 0V and 23V and currents between 0A and 5A.
By default, and as supplied for the V3.1 hardware, the sensors are set to be as the table below:
| Sensor | Current Range | Shunt Resistor | Shunt Size |
|---|---|---|---|
| S1 | 0 - 5 Amps | R4 | 0.025 Ohms |
| S2 | 0 - 2.5 Amps | R5 | 0.05 Ohms |
| S3 | 0 – 1.25 Amps | R6 | 0.1 Ohms |
When in doubt, use S1 as it has the largest current range, but for developments where the current draw is known to be within the lower ranges these would be better to use as they would give a more detailed view of currents drawn at different times.
Full information on the Lynsyn Lite can be found here: https://github.com/EECS-NTNU/lynsyn-host-software/wiki
Software Setup
Windows
(https://github.com/EECS-NTNU/lynsyn-host-software/wiki/Installing-on-Windows)
- Download the pre-built binaries (executables) of the Lynsyn tools. These can be found here:
DOWNLOAD LYNSYN TOOLS V1.3 LINK
(https://github.com/EECS-NTNU/lynsyn-host-software/releases) - Unzip the tools to a location on your computer.
The software tools are not installed and are just run from within this folder so it can be anywhere,
but for ease of use we would suggest C:\lynsyn\. - Install the driver for the card.
-
Connect the Lynsyn Lite to your PC. It gets power over the MicroUSB connection.
-
Open the Zadig application. Your PC may ask if you want to run it (UAC), you do.
It should pop up like this: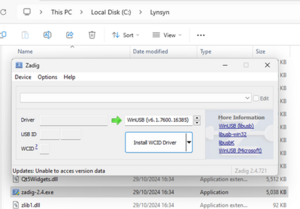
zadig application -
From the “Options” menu, select “List All Devices”.
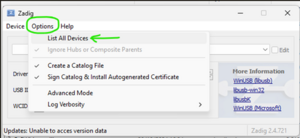
Zadig ListAll The drop-down box in the middle of the application will now be populated. Open this and select the Lynsyn.
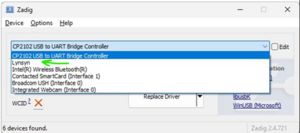
Zadig Select Lynsyn Press the button to Install / Reinstall driver.
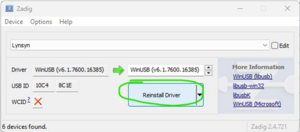
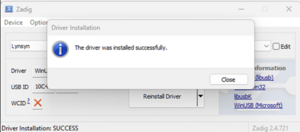
This may take a few minutes, please wait till you see the pop up saying that the driver was successfully installed:
Zadig Instal Done
-
The Lynsyn Lite should now be ready to use.
Linux
As there are many variations of Linux, this guide is for Ubuntu 22.04.
-
Open a terminal window and update and upgrade
sudo apt-get update && sudo apt-get upgrade -
Install the required dependencies for the Lynsyn project.
sudo apt install build-essential qtbase5-dev libqt5sql5-sqlite libusb-1.0-0-dev git dbus-x11 -
Clone the GitHub repository to your machine.
git clone https://github.com/EECS-NTNU/lynsyn-host-software.git -
Go to the cloned directory
cd lynsyn-host-software/ -
Run the make (Just type “make” – no inverted commas) file to compile the software. It will look like a lot has gone wrong, but as long as it says “Host software compilation successful” at the end, you are OK.
make -
Install the made software by running this command:
sudo make installAgain, it will say a lot, but as long as it shows “Host software compilation successful” and “Software and hardware installed” it is all OK.
You have now built the software packages required for the Lynsyn Lite.
Running the Power Measurement Tools
Windows
Recording a Session
From the command line
- Open a command prompt window and navigate to C:\Lynsyn (or wherever you saved the tools earlier)
-
To start logging a session you need to use the
lynsyn_samplerapplication.
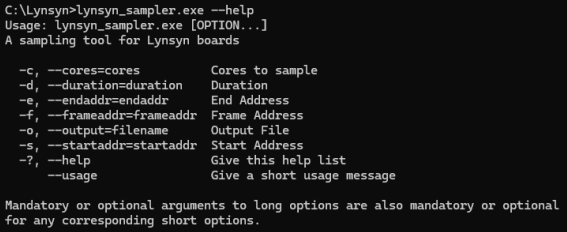
Lynsyn sampler windows
For this simple example we will be just setting to run the application for a 30 second session and saving the data to the default “output.csv” file. To run it for longer or shorter, just change the number at the end.
WARNING – These files can get large fast. This 30 second sample is around 63Mb.
The format for this is:
lynsyn_sampler -d 30
Running the Sampler for 30 Seconds Once finished you will get the command line prompt back.
From the GUI
From the Lynsyn folder you created, launch the “lynsyn_viewer.exe” application.
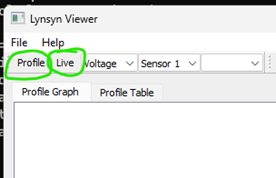
In the top left corner there are two buttons, “Profile” and “Live”
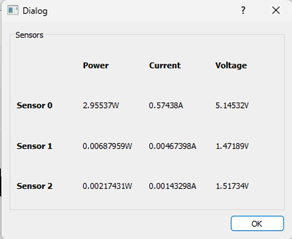
Pressing the “Live” button brings up a box showing what is happening NOW:
The “Profile” button brings up a box in which you select the length of the sampling you wish to have.
Pressing OK starts the sampling. When complete, “Profiling Done” is shown and the new set of samples are shown in the graph.
Next to these two buttons are three dropdown lists. One selects the parameter shown (Current, Voltage or Power), the second selects which sensor.
In our example, the third is un-used.
You can interact with the graph using your mouse. If you draw a box round a section (left button), it will zoom in. Left clicking will show the values at that point.
Right clicking will zoom out again.
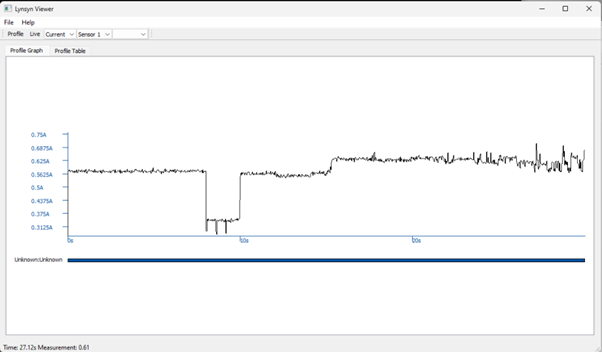
To save this data, go to “File” then “Export CSV.”
Viewing a Session if Recorded from the Command Line or from a Previous Save
If you recorded the session via the command line, from the Lynsyn folder you created, launch the “lynsyn_viewer.exe” application.
When opening it will display the previous result by default. To load the latest set of sampled data, go to “File” then “import CSV.”
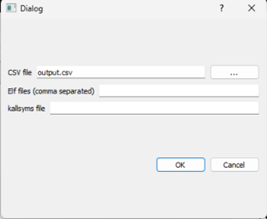
Select the file (by default it has “output.csv”) and press OK.
After a few moments it should say “Import Done” and a graph of the recorded session will be shown.

You can interact with the graph using your mouse. If you draw a box round a section (left button), it will zoom in. Left clicking will show the values at that point. Right clicking will zoom out again.
LINUX
Recording a Session
From the command line
- Open a terminal window. As you got, built and installed the files previously, you don't need to be in a specific folder to run the applications.
-
To start logging a session you need to use the
lynsyn_samplerapplication.
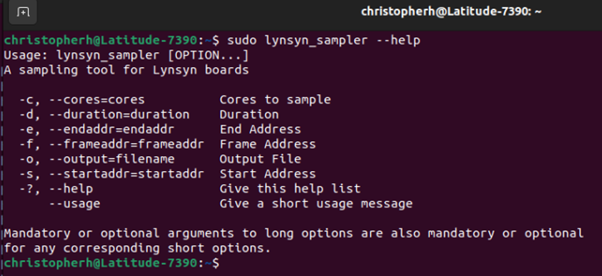
Lynsyn sampler windows
For this simple example we will be just setting to run the application for a 30 second session and saving the data to the default “output.csv” file. To run it for longer or shorter, just change the number at the end.
WARNING – These files can get large fast. This 30 second sample is around 63Mb
You need to be sudo so the computer can interact with the Lynsyn Lite..
The format for this is:
sudo lynsyn_sampler -d 30
Running the Sampler for 30 Seconds Once finished you will get the command line prompt back.
From the GUI
Open a terminal window and type:
sudo lynsyn_viewer
You need to be sudo for the computer to interact with the Lynsyn Lite.
This will launch the Lynsyn Viewer application.
Once loaded, in the top left corner there are two buttons, “Profile” and “Live”

Pressing the “Live” button brings up a box showing what is happening NOW:

The “Profile” button brings up a box in which you select the length of the sampling you wish to have.
Pressing OK starts the sampling. When complete, “Profiling Done” is shown and the new set of samples are shown in the graph.
Next to these two buttons are three dropdown lists. One selects the parameter shown (Current, Voltage or Power), the second selects which sensor.
In our example, the third is un-used.
You can interact with the graph using your mouse. If you draw a box round a section (left button), it will zoom in. Left clicking will show the values at that point.
Right clicking will zoom out again.

To save this data, go to “File” then “Export CSV.”
Viewing a Session if Recorded from the Command Line or from a Previous Save
If you recorded the session via the command line and wish to view the results, launch the “lynsyn_viewer” application sudo lynsyn_viewer.
When opening it will display the previous result by default. To load the latest set of sampled data, go to “File” then “import CSV.”

Select the file (by default it has “output.csv”) and press OK.
After a few moments it should say “Import Done” and a graph of the recorded session will be shown.

You can interact with the graph using your mouse. If you draw a box round a section (left button), it will zoom in. Left clicking will show the values at that point. Right clicking will zoom out again.